


It looked like a black bus slowly rising below the boat. One wrong move and you would be in the water with something that could swallow you whole – in one gulp.
The tranquil scene dotted with dolphins and sea turtles had instantly been replaced with a palpable fear and immediate respect for the ocean.
Welcome to an encounter with a humpback whale. The adults range between 39 and 52 feet and run around 79,000 pounds. Plenty of heft to cause you serious problems. If it’s a momma with her calf, you best make like a hole in the water and hope she doesn’t see a threat.
It’s that slow rise through the water that you’ve been waiting for. The Pacific Life commercial moment where the whale breaches and then heads back under with the signature wave of the massive tail.
These moments take place in the market every day. If you can spot the whale slowly rising, getting ready to breach – you can make a whale profit. All thanks to the whale trade strategy.
Statistics for whales are fascinating once you start looking at them. Humpbacks head underwater for 7-15 minutes at a time and have a top speed of 16 miles per hour – one of the fastest whale speeds in the ocean. Males actually have a song that they sing for 15-20 minutes, presumably part of their mating process. (As with any species, who really knows exactly why males sing for 15-20 minutes?)
Like whale watching in the ocean, when looking for a whale trade – you’re looking for a stock that has been ‘submerged’ for an extended period of time. Translating this to something you can actually spot with a chart or a screener – you’re looking for fractal energy build-up or periods of consolidation.
These periods of fractal energy build-up, or consolidation, are frequently followed by breakouts or breaches. Spotting these conditions gives you the edge you’re looking for when timing your entry.
To start, simply start a scan. Narrow your universe of stocks to those of at least $15 with volume of at least 1 million. Next, add a study filter – in this case a fractal study where the condition is greater than or equal to 55 on a monthly basis – and another on a weekly basis, and another on a daily basis.
You’ll find that your universe goes from 4,000+ stocks to just a handful of potential whales (32 in this case) that are getting ready to breach.
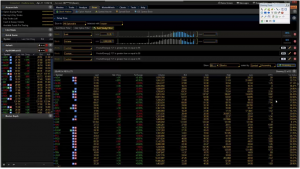
From 4,000+ stocks to 32 potential whale trades – in seconds!
Now that you have your list of whales, you just need to know what to look for.
If whales know how to do anything – they know how to put on miles. They spend their time in polar waters for feeding and then head to tropical waters for breeding and giving birth. That’s 16,000 miles round trip every year. Here’s the amazing part – they navigate these vast distances with amazing precision and predictability.
When it’s February, you know where to find the whales. The same is true with whale trades. Once you have your list in place, you’re simply looking for patterns – first on a monthly, then a weekly, and finally on a daily chart.
Remember that the fractal energy setting was north of 55 on the stock screen. Why? Fractal energy build-up indicates pent-up volatility that hasn’t yet been released. Over 55 and you’re looking at a lot of pent-up energy.
Couple this pent-up energy across a monthly, weekly and daily chart – and you have a move that’s in the making. Now you just need to know what direction the stock may be moving.
Check out the ticker below. You’ll see that the Fractal Energy reading is over 55 across the monthly, weekly and daily charts. Additionally, you’ll see that all three price patterns are moving up.
Now we have a trade that looks like it’s getting ready to make a big move up. For a bearish whale trade – all you’re looking for is the reverse.
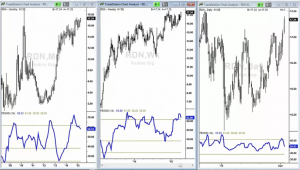
Know when a whale trade is about to breach by watching fractal energy and patterns across monthly, weekly and daily charts!
Now you need to zero in on the daily for your entry conditions.
In 1966 a moratorium on whale hunting was imposed after the global population was decimated (down almost 90%). Today the global population has recovered to around 80,000, which still means that spotting a whale is a special occurrence.
So you’ve gone to Hawaii in February and now you’re on the lookout for a whale. Guides will tell you to look out around 100 yards for a breach, followed by a tail. Up close encounters are very rare thanks to the advanced sonar whales have – they can steer clear of boats.
In the market, you’re looking for a breach in the form of a daily pullback and consolidation. The stock is telling you, in the context of the larger time frame (monthly and weekly), the overall direction. Now we’re looking for a pause in the action. This will tell us the whale stock is resting just a moment before making its next push.
Here is NFLX showing the exact kind of consolidation we’re looking for. Moving sideways, or just slightly in a trend.
Now we’re ready to start shopping the options chain for the price level we want to enter on – and the time to expiration that we’re the most comfortable with.
One important detail as you evaluate your entry: These trades should be so small in size that any losses will hardly be noticeable. This is because the payoff will be large when they hit – but you only want to expose a small amount of your capital base to this position once it’s taken.
That’s right, leave the income-producing trades that consume more of your capital to non-directional trades like iron condors.
Now that you know how to spot the whales, trade them with confidence with small portions of your account as part of an integrated options system.
