


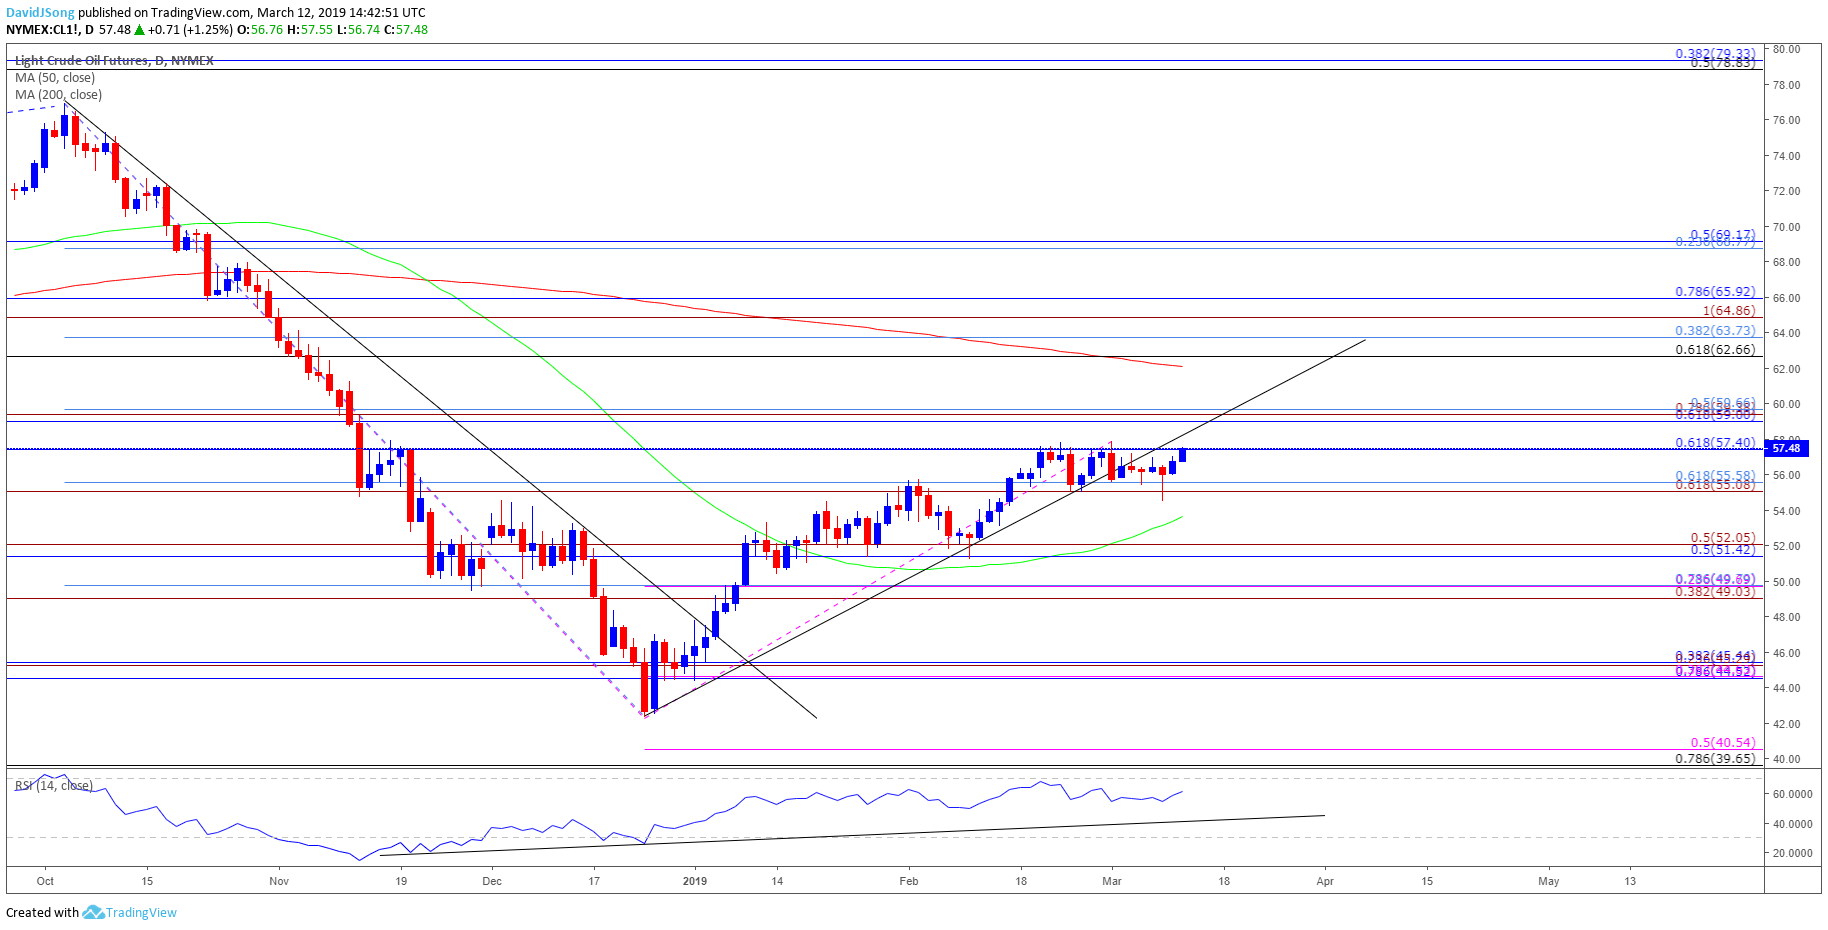
The recent rebound in crude appears to be stalling ahead of the monthly-high ($57.81) even as Organization of the Petroleum Exporting Countries (OPEC) keep a lid on production, and the price of oil stands at risk of facing a larger pullback as the Relative Strength Index (RSI) reverses course ahead of overbought territory.

Fresh comments from OPEC Secretary General Mohammad Barkindo suggest the group will continue to regulate supply despite the recent tweet by U.S. President Donald Trump as the official notes that the efforts to rebalance the energy market are still a ‘work in progress.’
It seems as though OPEC and its allies will at least fulfill the six-month agreement to shore up oil prices as the most recent Monthly Oil Market Report (MOMR) projects a further reduction in oil demand, and the current environment may keep crude prices afloat as the group shows little to no interest in abandoning the extraordinary efforts.
Harness the Rarest & Most Explosive events in the market…High Velocity Alignments!
Many of the great Titans of Wall Street owe their vast wealth to this phenomenon. Legendary investors like Paul Tudor Jones have used it to amass fortunes of $4.7 billion and more. Now, for the first time ever…you’ll have the power to harness them for yourself.
See trades like…
When these ‘High Velocity Alignments’ fire…you have to act fast!
It remains to be seen if the OPEC+ alliance will be extended again as the International Energy Agency (IEA) states that ‘the United States will account for 70% of the increase in global production capacity until 2024, adding a total of 4 mb/d,’ and the ongoing expansion in non-OPEC production may force the group to take additional steps as Russia Energy Minister, Alexander Novak, asserts that the region is on track of meeting its commitment of reducing output by 228Kb/d by the end of March.
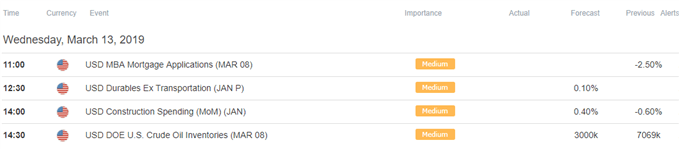
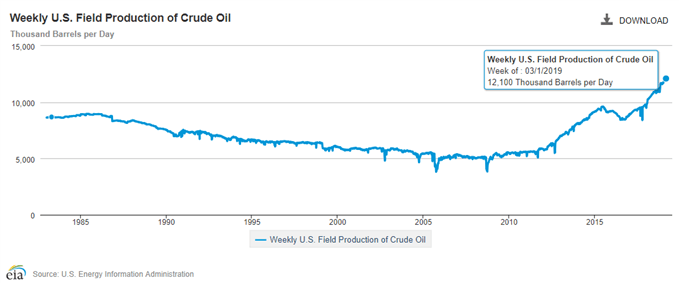
However, updates from the U.S. Energy Information (EIA) are anticipated to show crude inventories climbing another 3000K in the week ending March 8, with weekly field output currently holding at the record-high of 12,100K b/d in the week ending March 1, and signs of easing demand paired with the gradual rise in non-OPEC production may drag on oil prices as the OPEC+ alliance is set to expire in June.
With that said, the advance from the 2018-low ($42.36) may continue to unravel ahead of the next OPEC meeting in April as price fails to hold trendline support, and the Relative Strength Index (RSI) may highlight similar dynamic as the oscillator reverses course ahead of overbought territory.Sign up and join DailyFX Currency Analyst David Song LIVE for an opportunity to discuss potential trade setups.
Have a nice day and I sure hope this article helps you in your trading.

