


Wall Street traded on both side of the ledger before snapping a four session slide following Wednesday’s overall win. Nervousness over Nvidia’s (NVDA) earnings after the close may have been attributed to some of the intraday weakness with volatility also holding a key level of resistance.
The RSI (relative strength index) for the major indexes were nearing oversold conditions heading into Wednesday’s session. A reading at 30 and under indicate oversold levels and when a stock or index is typically due to rebound. The mostly higher closes helped flatten out the bearishness but that could change if lower lows come into play. RSI can trade into the 20’s and mid-teens and reach extremely oversold conditions before buying might come in.
The Dow’s RSI was at 42 on Tuesday and closed at 40 on Wednesday. The S&P’s RSI was at 41 and closed at 41. On Tuesday, the Nasdaq’s RSI was at 36 and closed at 38 yesterday. As for the Russell, it’s RSI moved up to 33 from 32.
The current charts are going to show much longer-trading ranges in play from last September and November for the major indexes. The small-caps started consolidating in mid-December.
The Russell 2000 closed below 2,175 on Wednesday to keep near-term risk down to 2,135 in play. This level was prior resistance before the September 12th breakout.
Closes back above 2,200 and the 200-day moving average would be slightly bullish but more important hurdles are at 2,225 and 2,260 and the 50-day moving average. The index has remained in a 150-point range between 2,175-2,325 since mid-December.

The S&P closed below 6,000 on Monday and fell out of its uptrend channel on Tuesday. Wednesday’s backtest to both levels held into the closing bell as the index only added a point. A drop below 5,900 and Tuesday’s low at 5,908 would likely confirm an ongoing fade to backup support at 5,850.
Resistance is at 6,100 with last Wednesday’s all-time top at 6,147. The index has basically stayed in a 250-point range between 5,850-6,100 since mid-December.

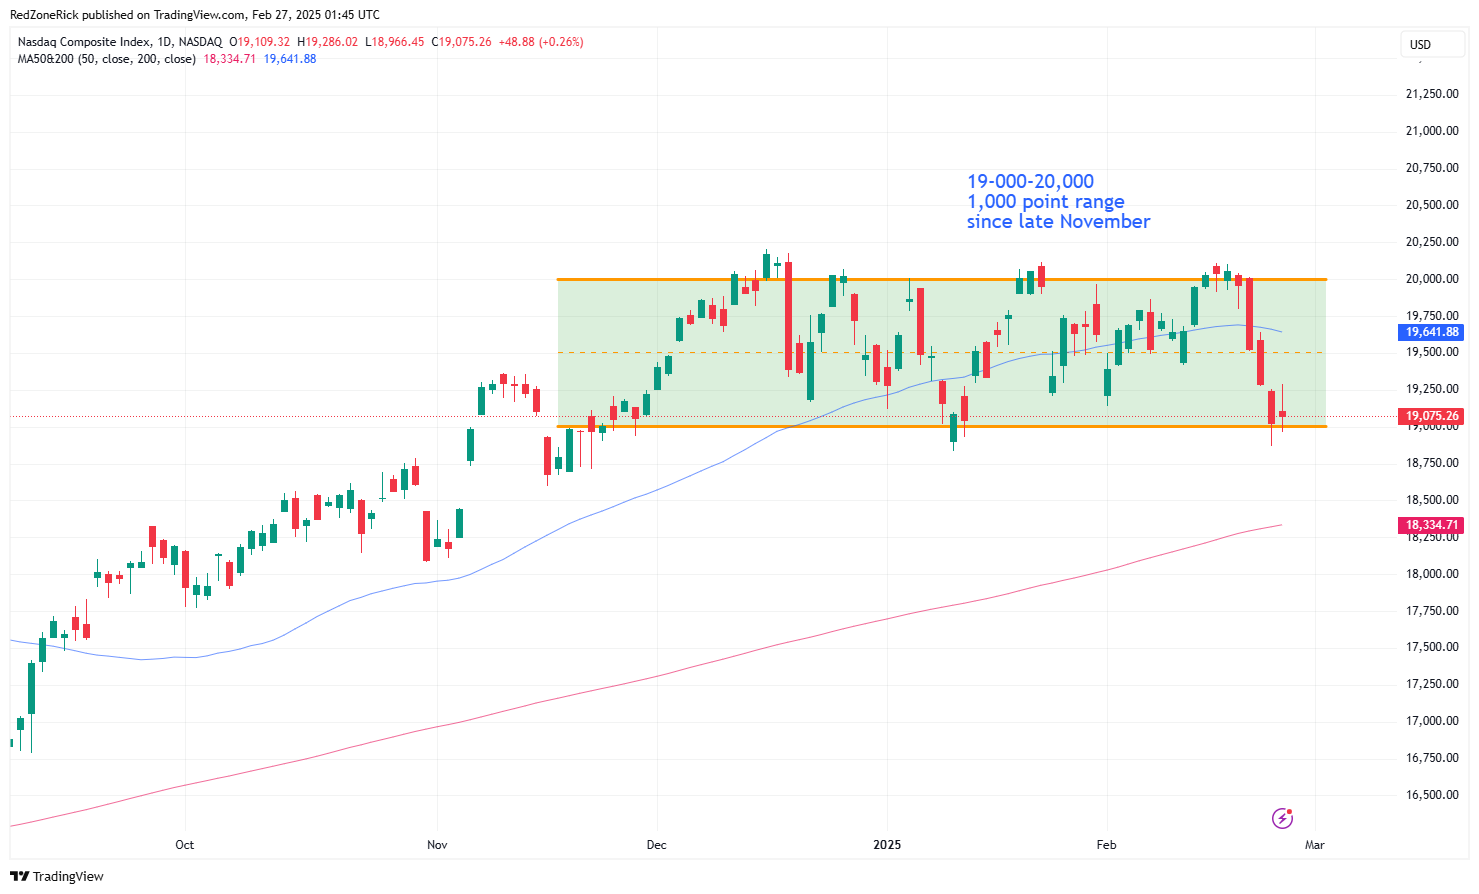
The Nasdaq came within 40 points of its January low at 18,831 following Tuesday’s trip down to 18,871. A close below either of these levels would likely imply a further slide to 18,600 and support from mid-November.
Key resistance is now at 19,250 followed by 19,500-19,750 and the 50-day moving average. The index has traded in a 1,000-point range between 19,000-20,000 with more upside than downside stretch since late November.
The Dow’s has traded in a tighter range over the past four sessions and has been trying to hold its uptrend channel. The chart work can be adjusted but a close below 43,250 opens up downside pressure down to 42,500, possibly 42,000. The January 10th low hit 41,877 and the following Monday low touched 41,844.
Lowered resistance is at 43,500-43,750. A close back above the latter and the 50-day moving average would be slightly bullish but a better setup would be continued closes back above 44,000. The index has stayed in a 3,000-point range between 42,000-45,000 since mid-September.

The Volatility Index (VIX) popped above 20 for the third-straight day but a level that held. There is wiggle room up to 22-24 with a move above the latter likely inducing selling pressure in the market. Key support is at 17.50.

Nvidia (NVDA) announced earnings of 89 cents a share after Wednesday’s close. This was nearly a nickel above expectations. Revenue of $39.33 billion was $1.23 billion higher than expected.
Shares showed initial gains following the news but were back below $130 in extended trading last night. Traders were obviously looking for a much larger beat.
A 91% win rate is harder and harder to come by these days…
Heck most traders would die for a 70%+ win rate on ANY trade strategy…
Yet here we are. And traders can now use 3 simple trades with an easy to follow ‘pyramid’ system designed to scale risk and reward while doing a better job of allocating your precious trading capital.
Why did traders fall in love with this system in 2024? Because they can mix and match each of these 3 simple trades – using many of the same tickers over and over.
That means it’s repeatable.
And done properly – can make your results more and more consistent over time.
So you have a system that you can use for a lifetime.
Go here… watch this video see if you like the strategies.
(guess what? you can access them for just $5 bucks if you like what you see)
