Players in the FX and other markets have become accustomed over the past couple of years to identifying trading environments as “risk on” or “risk off”. The “risk on” days are characterized by rising stocks, lower bonds, precious metals meandering to down, and the Dollar, Yen and Swiss Francs getting sold versus most other currencies. The “risk off” variety tends to see stocks down and bonds up, with the safe haven currencies (USD, JPY, CHF) happily bought, along with precious metals. Very broadly speaking, “risk on” days tend to correspond to data points that suggest that the global economy or its main drivers (the U.S., the Eurozone and China) are likely to expand, while “risk off” days signify the reverse. The market isn’t always consistent about the triggers, but the results tend to be fairly predictable. Of course, recently “risk on” and “risk off” days have switched back and forth quite rapidly.
Those students who saw Todd and Craig’s recent seminar on managing volatility will recalll that one of the suggested techniques was to step back, and take a look at broader timeframes. Since academics and practitioners actually agree that currencies exhibit identifiable trending properties, this makes sense for currencies in any case. The methodology that Todd teaches, I’ve found, works well across time frames and asset classes, and I’ve come to use his techniques in identifying currency trades and then managing them once they’ve been entered.
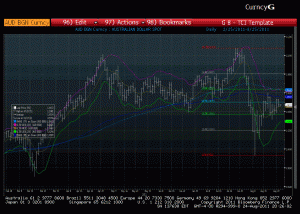
I was looking through daily charts of currencies this evening, and found one that looked interesting; the “risk on” Australian Dollar vs the U.S. Dollar (AUD/USD). Aussie on the daily chart hit a recent high of 1.1081 on July 27, and by August 9 had dropped a substantial 10.4% to .9928. The Australian Dollar, which offers a yield roughly 3.5% higher than the USD on an annual basis, tends to become very crowded in “risk on” environments; when traders hit the exits , it’s often in reponse to a negative economic report out of regional powerhouse China, an important buyer of the commodities produced by Australia. The stampedes that result frequently leave traders crumpled up by the doors.
That’s the background; what’s more interesting is that within the downtrend on the daily chart, AUD has pulled back to a level that Todd’s methodology identifies as a potential short trade entry, in the neighborhood of 1.0470. In addition, there appears to be potentially strong resistance at the 1.0630/35 level (1.5% away) which would offer an opportunity to sell more, and provide a logical stop if the trade refused to behave properly. The minimum profit objective would be 50% of the distance between the entry level to the recent low, or 1.0470 – (1.0470 – .9928/2), or 1.0199. Let’s call it 1.02. That would represent a minimum objective of 270 points (.0270), while a logical stop level would be above 1.0635, say 1.0655, 185 points (.0185) away. The trade thus has a better than 1/1 ratio of profit objective to stop; so far, so good.
A complicating factor in foreign exchange is in interest rate differentials. Traders who are long AUD have to roll their positions forward, and as mentioned previously, since the annual interest rate differential between Australia and the U.S. is roughly 3.50%, the position will cost slightly more than  1 point (.0001 ) every day the position is held. The basic principle is that forward rates will adjust until the buyer and seller of AUD and USD are indifferent as to which currency they are holding, which at present works out to 375 points (.0375) a year.
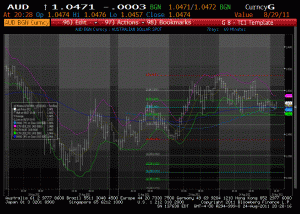
The economic background, and the interest rate differentials, are something to be aware of in deciding how much potential profit is required to enter the trade; once that decision is made, the analytical tools taught by Todd can be used to select entries, profit objectives, and stops. A look at the hourly chart suggests that in this timeframe, the currency is ever so reluctantly trending higher, so if the decision is made to open a position around the 1.0470 level, it might be worthwhile to wait for a push below the support in this time frame at 1.0455, which has occurred as I type.
Hopefully, this helps to provide an overview of some of the factors that go into identifying a potential FX trade, and the use of some of the tools that Todd offers his students in managing positions. So far, this looks like it might well work; the currency is currently trading at 1.0437, after falling to 1.0430. If it now bounces back to what had been support on the hourly  around 1.0455, and that level holds, confidence that this is a good trade at the right level will be even higher. It is a volatile currency, however, so if it is to be added to, and then stopped above logical resistance, those levels should always be in place as orders. I know from experience how difficult it is to make a decision upon being awakened from a sound sleep by a colleague with a surprising piece of economic news. Best to leave the levels, secure in the knowledge that they’ve been selected objectively.